Nowadays, PC game developers now have unprecedented, in-depth access to a GPU and can easily analyze graphics, async compute usage, event timing, pipeline stalls, barriers, bottlenecks, and other performance inefficiencies.
This unique tool generates easy to understand visualizations of how your DirectX 12, Vulkan, OpenCL, amd HIP applications interact with the GPU at the hardware level. Profiling a game is both a quick and simple process using the Radeon Developer Panel and our public GPU driver.
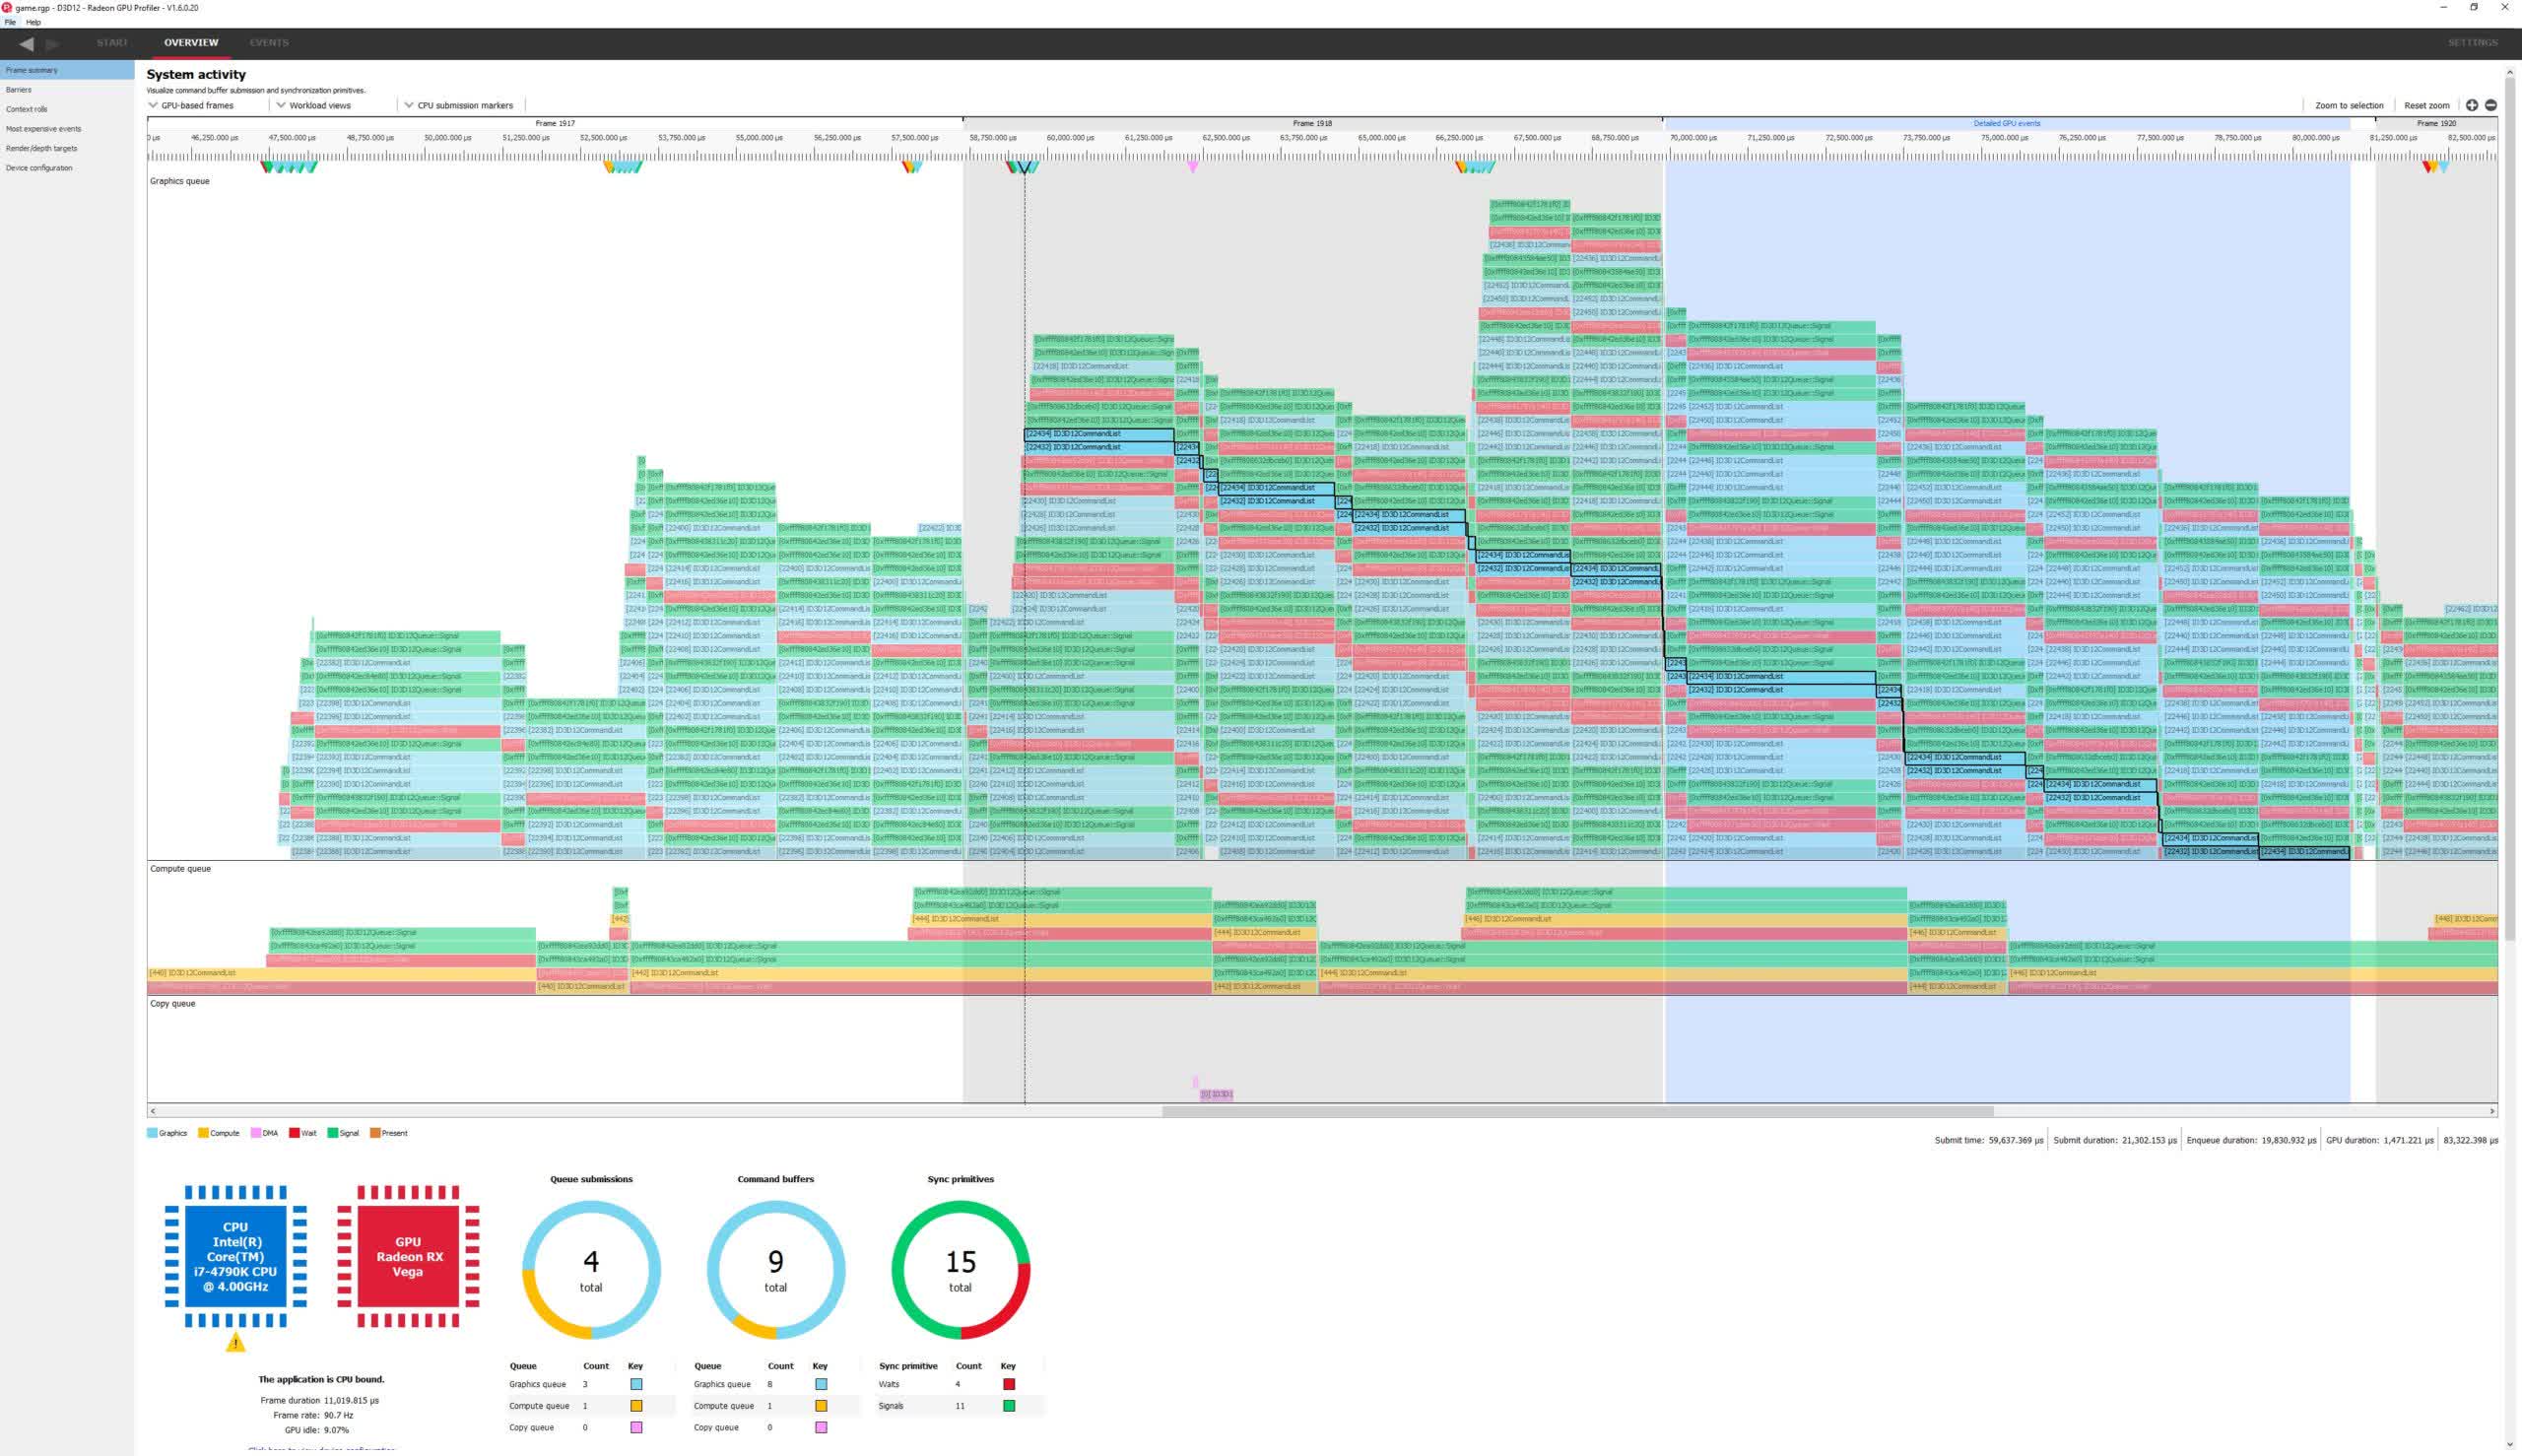
Figure out your frame
Get a bird's eye view of how your command buffers got submitted to each GPU queue. Understand how your graphics, async compute, and copy workloads interact and synchronize.
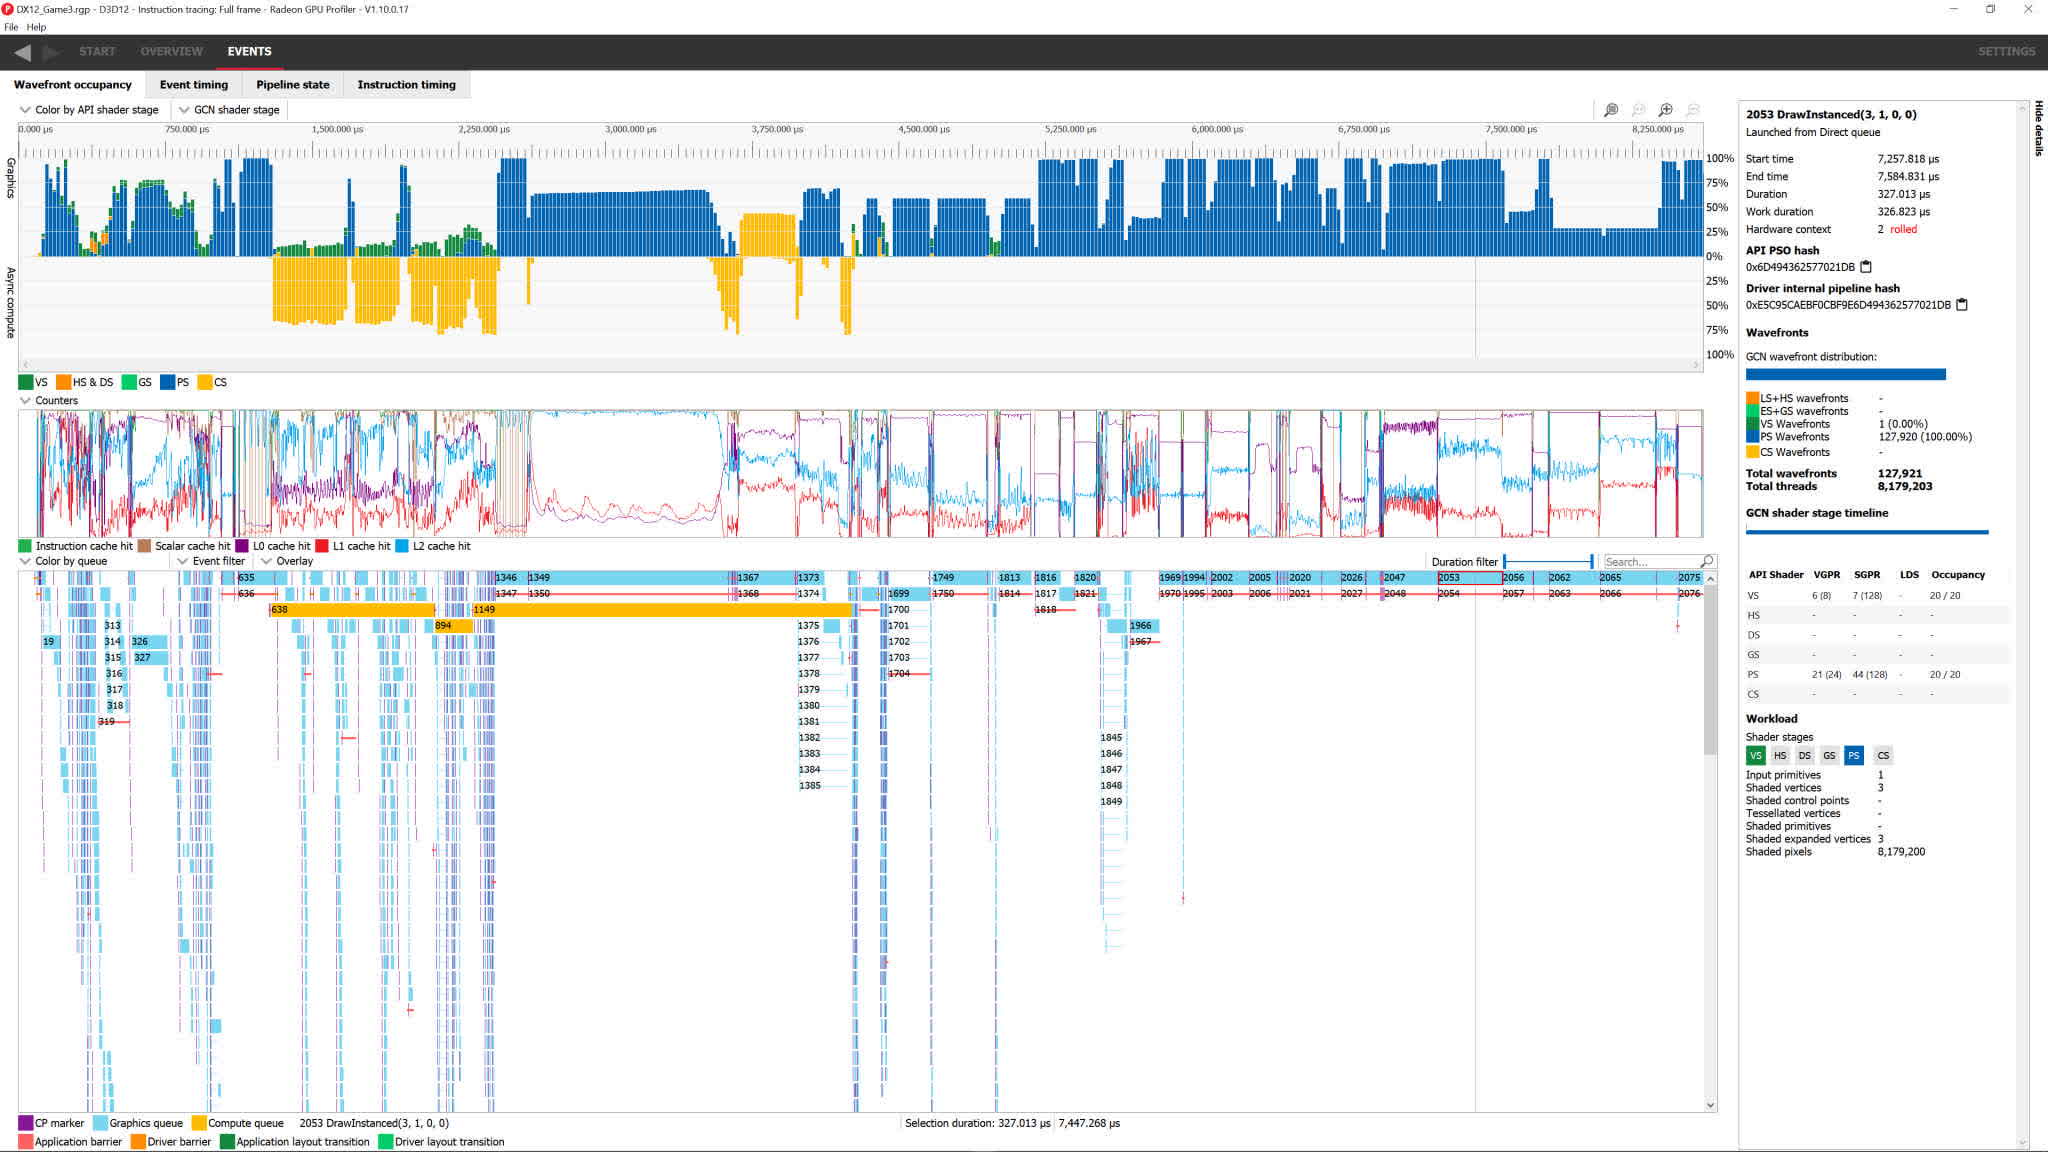
Wade through your wavefronts
Understand how your wavefronts were pushed through the GPU. We can also correlate between wavefronts and the GPU events which launched them, and provide insight into how your frame utilizes the various GPU memory caches. The data displayed in this view is highly filterable, groupable, and includes a side panel with added detail about user selections.
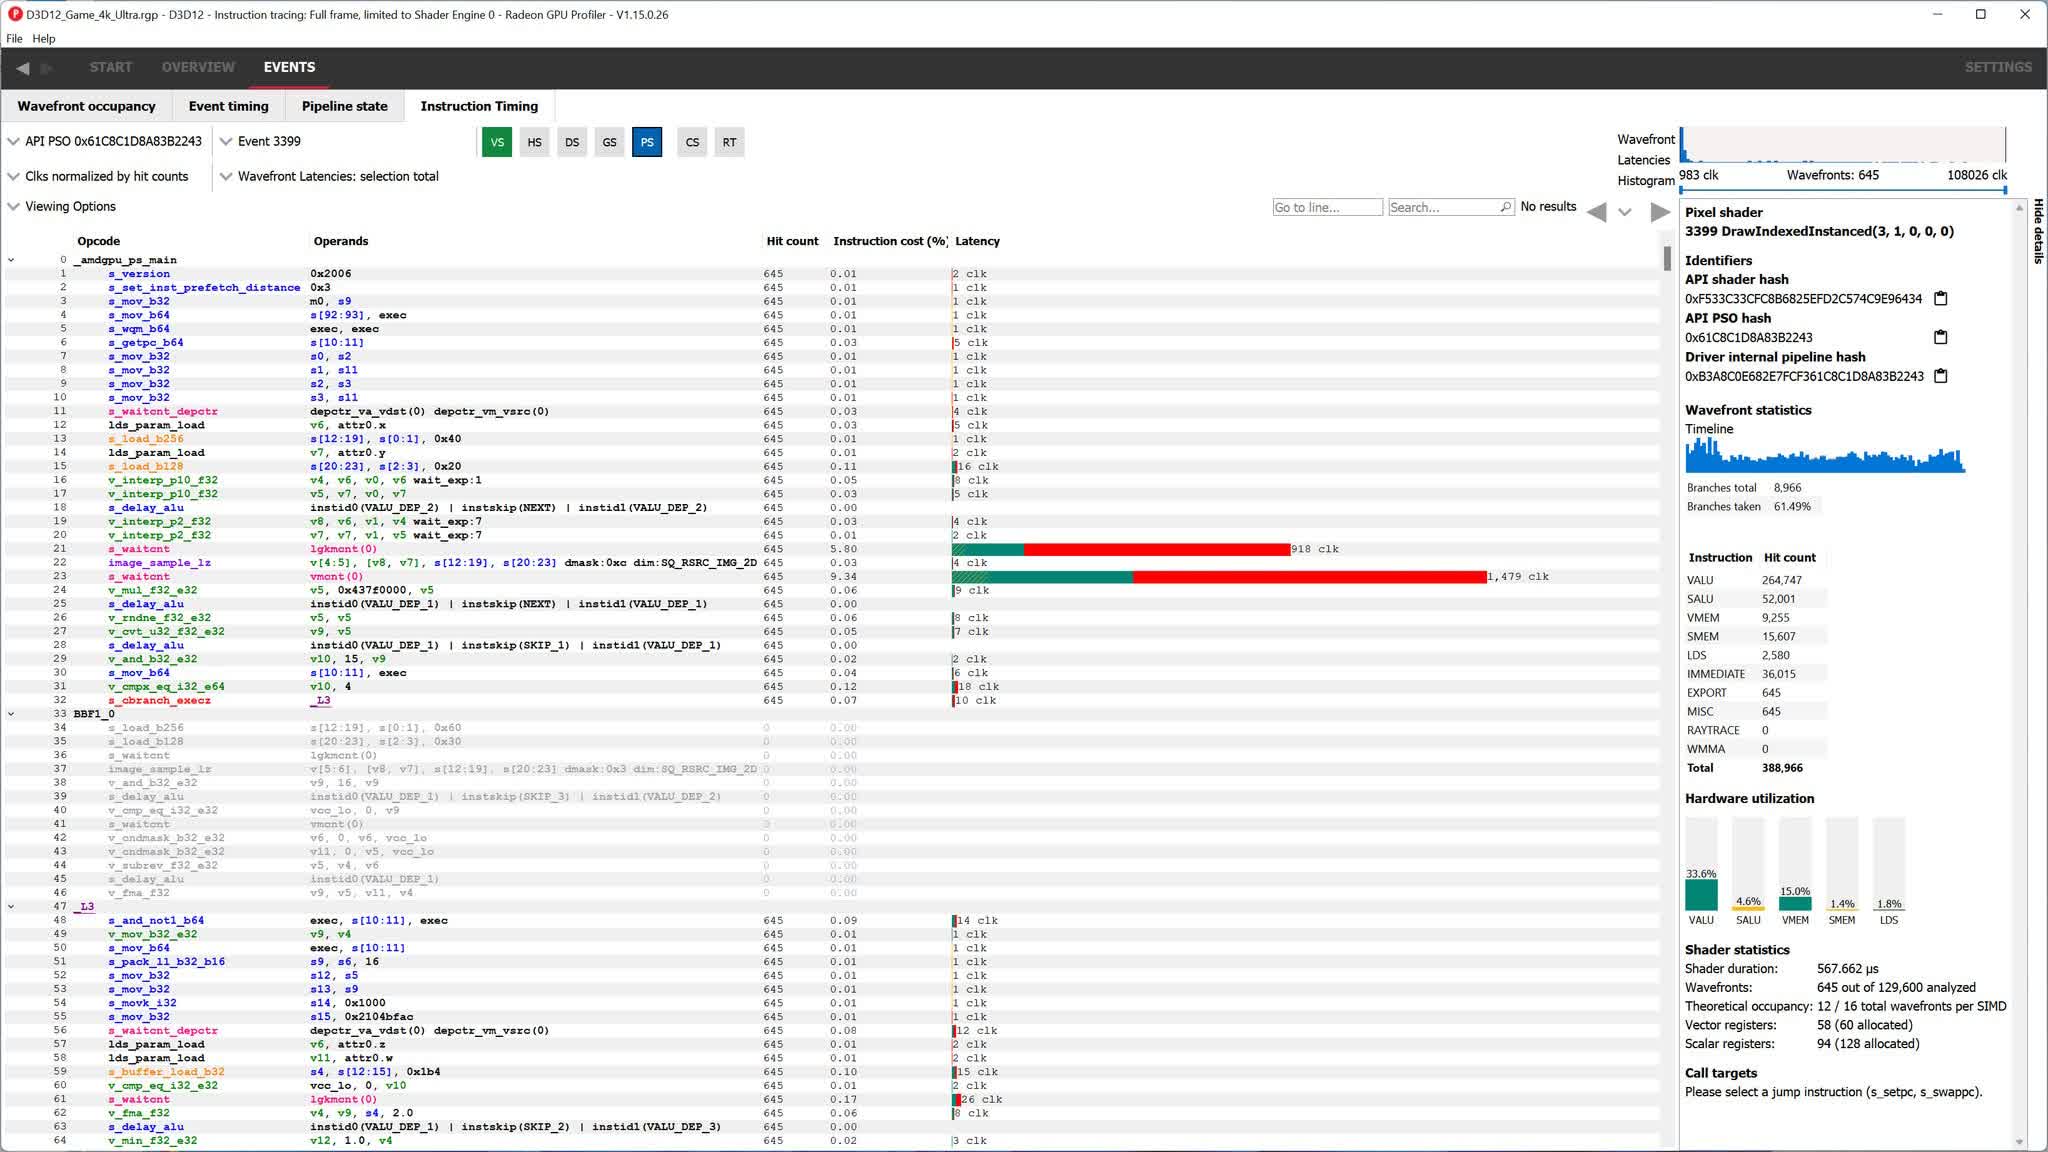
Speed up your shaders
Quickly and easily find hotspots in your shaders using the instruction timing view. Each instruction in your RDNA ISA has a bar showing its average latency, allowing you find the right things to optimize.
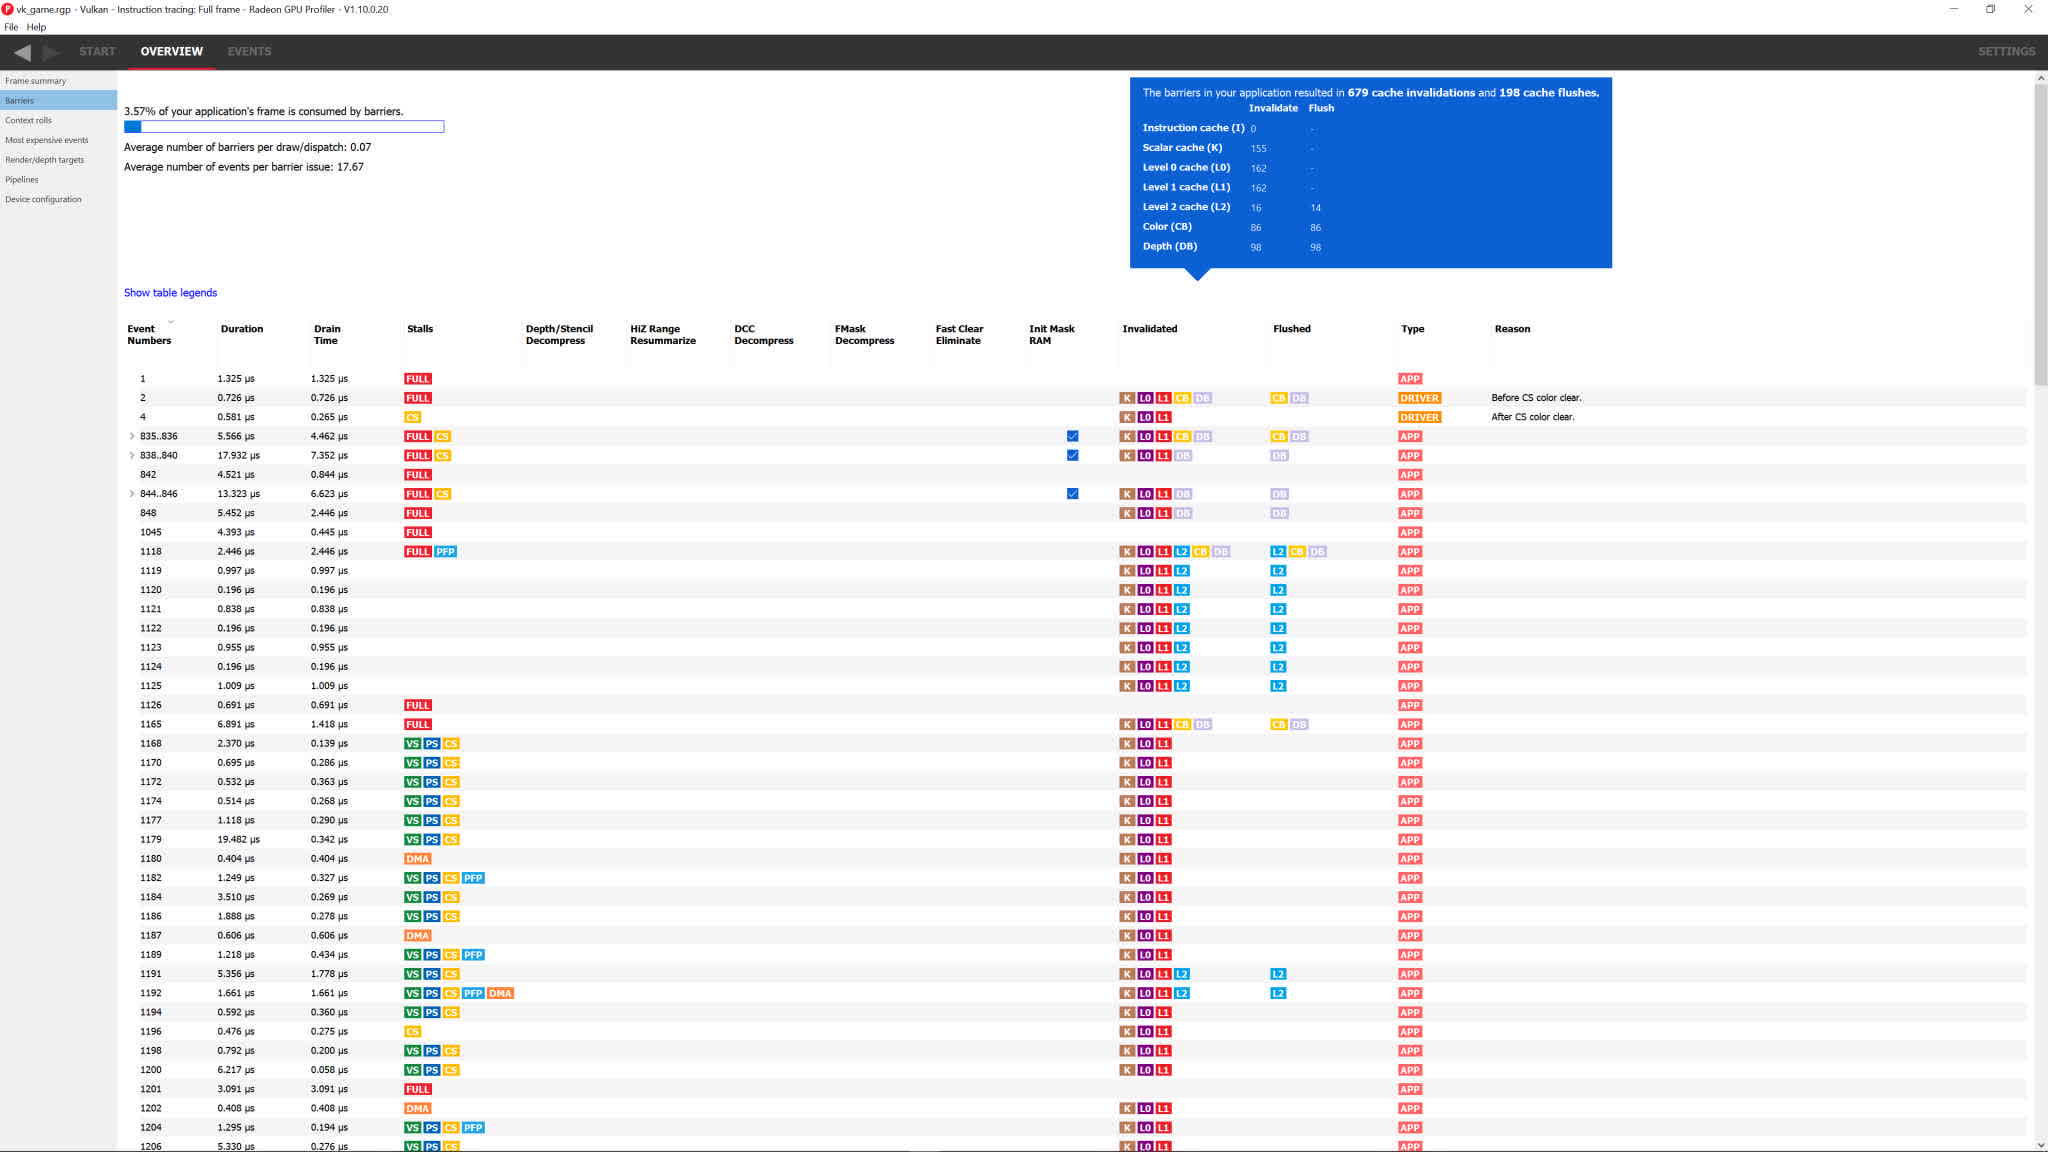
Banish those barriers
Find out which barriers flushed caches, caused a synchronization point or even ran their own, internal shaders. Burst those pipeline bubbles and claim back your performance.
What's New
- Newly redesigned ISA disassembly views in the Pipeline state and Instruction timing panes
- Code blocks can now be collapsed/expanded
- Selected token highlighting allows you to quickly see other instances of the selected token (instruction opcodes, registers and constants)
- One-click navigation between branch instructions and their targets, along with tracked navigation history
- Customize the displayed columns
- Improved search result highlighting
- Improved performance in the System activity timeline in the Frame summary pane when opening large profiles
- Instruction timing side panel will now report the total number of WMMA (wave matrix multiply accumulate) instructions executed by a shader when running on RDNA 3 or newer hardware
- Pipeline state pane will now report when conservative rasterization is enabled
- Fixed issues with keyboard selection in the tree view in the Event timing and Pipeline state panes
- DirectX 12 Mesh shader functions and Vulkan Mesh shader extension functions now are identified properly in RGP's event lists
- Fixed incorrect tree hierarchy in the Event timing and Pipeline state pane when events are grouped by user events and event filtering is used
- Fix an issue with missing counter data in RDNA 3 captures
- Fix an issue with Pipeline state pane showing more than 256 VGPRs allocated for some shaders in RDNA 3 captures
- Fix an issue with time units not updating in the Instruction timing Details panel when the Time Units setting is changed
- Fix an issue with searching not finding matches in the Latency column in the Instruction timing pane
- Fix an issue with missing commas when copying ISA instructions to the clipboard from the Instruction timing or Pipeline state pane
- Fix a few minor visual glitches in the ISA display in the Instruction timing or Pipeline state pane
